
Analytics
The Analytics module (found under Reports in the sidebar) gives you a real-time snapshot of how your business is performing — from revenue and project pipeline to quote conversion and inventory usage.
Overview Dashboard
Click Reports in the left sidebar (under Analytics) to land on the main dashboard. Across the top, five key metrics summarize your business at a glance:
- Total Revenue — calculated from approved quotes
- Active Projects — how many projects are currently in progress
- Quote Conversion — the percentage of quotes that turn into won deals (shown as won / total)
- Inventory Utilized — the percentage of your total inventory currently in use
- Shipments On-Time — percentage of shipments delivered on schedule
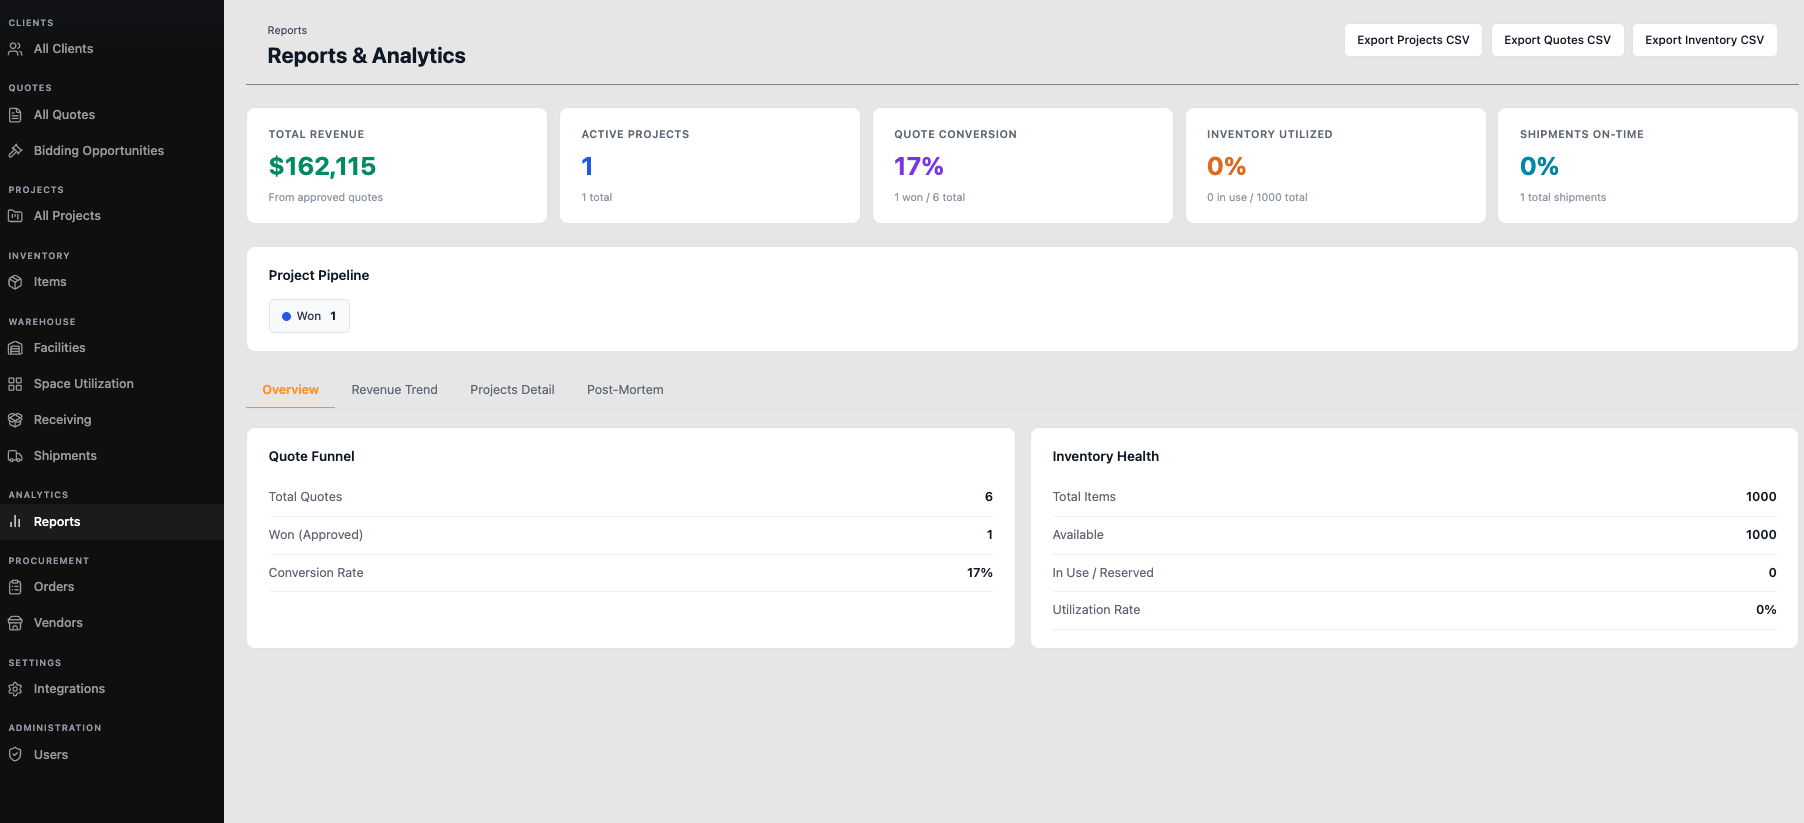
Below that, Project Pipeline gives you a quick visual breakdown of where your projects stand (e.g., how many are in "Won" status).
Overview Tab Details
The dashboard is organized into tabs — Overview, Revenue Trend, Projects Detail, and Post-Mortem. The Overview tab (shown by default) breaks the top metrics down further into two panels:
- Quote Funnel — Total Quotes, Won (Approved), and Conversion Rate
- Inventory Health — Total Items, Available, In Use/Reserved, and Utilization Rate
⚠️ Work in progress: The Revenue Trend, Projects Detail, and Post-Mortem tabs are part of the Analytics module but aren't documented in detail yet. This section will be expanded as more data becomes available to capture and explain each one properly.